Users' Guide For FRS Trading Indicators
This is the users' guide for our Fractals Reversal Scheme (FRS) indicators. You may consider information supplied on this page as a users' guide for any version of our FRS18* trading indicators
INSTALLATION
Take the following steps to install and activate your copy of FRS18*.Step 1:
Copy FRS18*.ex4 file into the 'Indicators' folder of your MT4 platform.
From the menu bar locate "lndicators" folder thus:
File > Open Data Folder > MOL > Indicators
Note: You need to close, and re-open MT4 platform.
Step 2:
On the menu bar, click on "Insert > Indicators > Custom > FRS18*" to load FRS18*. Indicator's property box would pop up on the screen.
Step 3:
On the property box, click on the 'common' menu button and locate the 'Allow DLL imports' checkbox. Click to enable the checkbox.
Step 4:
click on the 'inputs' menu button and scroll down the input parameters to locate AUTHENTICATION inputs' group.
Step 5:
Enter your email address [and unlocking code, if you have one] into value fields for the parameters, and also set "Reset Device ID" to "true" and press OK.
Note:
* Ensure to enter your valid email address with which you subscribed for FRS18*.
* Leave the field for unlocking code empty if you do not have one.
Step 6:
Click on the OK button on the property box to set values for authentication process.
Note:
* Your trading platform must be connected to the internet for authentication process to succeed.
* Results of the authentication process are returned either as text labels on the chart or as audio-visual alerts. Please pay attention to server's response.
In case of any issue, feel free to call developer's support lines:
+234 813 4053 085
+234 909 7365 737
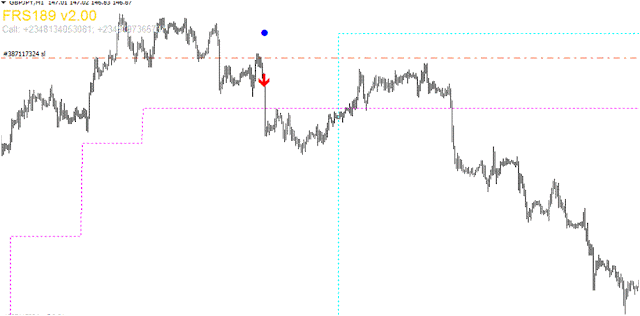
LINES AND OBJECTS PLOTTED BY FRS18*
FRS18* basically plots four (4) price lines which are described thus:LINES:::
Buy Line - useful for determining BUY trade entries .
Support - useful for identifying price region BELOW which market prices might continue to fall.
Sell Line - useful for determining SELL trade entries.
Resistance - useful for identifying price region ABOVE which market prices might continue to rise
ARROWS:::
FRS18* also, by default, plots a set of colored arrows and dots on chart.
* Blue Upward Arrow - which represents a Buy trade entry.
* Red Downward Arrow - which represents a Sell trade entry.
* Red Dot (located directly below Buy arrow) - represents exit price for the corresponding Buy trade.
* Blue Dot (located directly above Sell arrow) - represents exit price for the corresponding Sell trade.
TARGET FIB0:::
In order to make determining take-profits (TPs) for your trades easy, FRS18* auto-calculates and plots a customized target Fibo levels when you click on an entry arrow.
Note:
> FRS18* automatically includes "spread" for the traded instrument in calculating target prices for sell trades.
> To display target Fibo, click on an entry arrow or on the time axis of the arrow.
> To delete target Fibo, click anywhere on chart.
SUPPORT
For further info about FRS18* trading indicators and other trading software, contact developer's support lines:+234 813 4053 085
+234 909 7365 737
H-a-p-p-y t-r-a-d-i-n-g !!!
Comments
Post a Comment
To sign up for a FREE TRIAL of FRS trading indicators, contact Developer on +2348134053081 or +2349097365737